
7 posts tagged with "Plugins"

View All Tags

· 12 min read
Sandip Gahlot

Introduction

This blog will provide information on how we can create a Backstage Frontend plugin as well integrating it with an existing Backstage Backend plugin. The Backend plugin we will use in this article will be the Local System Information plugin mentioned in another blog.

We will make some modifications to the backstage backend to wire the backend plugin into the Backstage app and then move on to create a new frontend plugin. Once everything is in place and we have verified the frontend plugin integration with the backend plugin, we will then analyze the code that makes it possible.

Prerequisites

To start, please make sure that the following tasks have already been performed:


Modifying the Backstage backend

The backend plugin exposes the /system-info endpoint that is only available using curl, and is not accessible through the Backstage app by any Frontend plugin. To expose and make use of this backend plugin in our app, we will need to wire the plugin's router into the Backstage backend router.

Exporting the backend plugin router

  • Create a new file named packages/backend/src/plugins/local-system-info.ts with the following content:

    packages/backend/src/plugins/local-system-info.ts
    import { createRouter } from '@internal/plugin-local-system-info-backend';
    import { Router } from 'express';
    import { PluginEnvironment } from '../types';

    export default async function createPlugin(env: PluginEnvironment): Promise<Router> {
    return await createRouter({
    logger: env.logger,
    });
    }
  • Wire the backend plugin router into the Backstage backend router by modifying packages/backend/src/index.ts:

    • Import the newly added file for our backend plugin into the packages/backend/src/index.ts.

    • Then add the plugin into the backend by adding the following line into the main function after the existing addPlugin calls.

      packages/backend/src/index.ts
        import ...
      ...
      import sysInfo from './plugins/local-system-info';
      ...
      ...
      async function main() {
      ...
      await addPlugin({ plugin: 'search', apiRouter, createEnv, router: search });

      await addPlugin({plugin: 'sys-info', apiRouter, createEnv, router: sysInfo,});
      ...
      }

Modifying the package.json to run the backend plugin

The command to start the Backstage (yarn start) starts both the app and backend as well as any other workspaces found in the plugins directory, which also includes our new backend plugin.

Ideally, one would want to publish the backend and frontend plugins and then simply install that plugin to use it. But since we are setting up both the backend and frontend plugins in our local development environment, the yarn start command will try to start the app and the backend plugin along with the Backstage backend. Both the backend plugin as well as Backstage backend processes listen on port 7007. This will cause a port conflict when the Backstage app starts.

To resolve this issue, we can either modify the package.json in the root directory to add a new script to only run the app and backend, or run two commands to start the app and backend separately.

Modifying the package.json

Modify the package.json in the root directory by adding the following content in the scripts section (just after the start script entry):

package.json
{
"name": "root",
...
"scripts": {
...
"start": "turbo run start --parallel",
"start-dev": "turbo run start --filter=app --filter=backend",
...
},
...
}

Alternate method to start Backstage

  • In case one does not want to modify the package.json, an alternative method to start backstage is to run the following two commands in the root directory of the backstage-showcase repository, in two separate terminals:
yarn workspace app start
yarn workspace backend start

Modifying the backend plugin response

In the plugins/local-system-info-backend/src/service/router.ts file, move all the elements except cpus to the data element so that it is easier to parse and display in the frontend plugin:

plugins/local-system-info-backend/src/service/router.ts
const systemInfo = {
data: {
hostname: os.hostname(),
operatingSystem: os.type(),
platform: os.platform(),
release: os.release(),
uptime: os.uptime(),
loadavg: os.loadavg(),
totalMem: os.totalmem(),
freeMem: os.freemem(),
},
cpus: os.cpus(),
};

Verifying that the backend plugin is available through the Backstage app

To verify the changes done to the backend plugin, run the Backstage backend with yarn start-backend in the root directory of the backstage-showcase repository.

Since we have yet to create a frontend plugin, we will still need to use a curl command to invoke the backend plugin. However, we will access the endpoint provided by the backstage backend router similar to how it would be accessed by a frontend plugin:

curl localhost:7007/api/sys-info/system-info | jq
  • When running in the Backstage backend, it is accessed with a prefix of /api (from the cli or app)
  • The backend plugin is exposed on the /sys-info main route (which matches the plugin name when we registered the plugin in the packages/backend/src/index.ts file)
  • The API endpoint for providing system information is /system-info

After verifying the endpoint, you can now stop the backend by killing the yarn process.


Creating the Frontend plugin

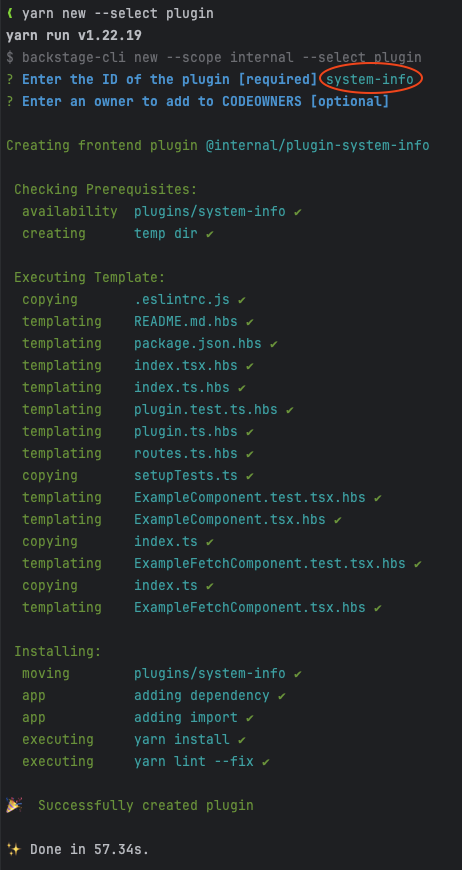
To create a new frontend plugin, please execute the following command in the root directory of the backstage-showcase repository in a terminal:

yarn new --select plugin

When prompted to enter the ID of the plugin, please provide system-info. Here's the output from running this command in my terminal:

Creating a new Plugin

Verifying the new Frontend plugin

The above command will create a new Backstage frontend plugin and will also add it to the Backstage app. To verify the new plugin, run the app with yarn start-dev in the root directory of the backstage-showcase repository, or by following these steps. Once the app starts up, the new plugin can be verified by navigating to http://localhost:3000/system-info

Integrating the frontend plugin with backend plugin

The newly generated frontend plugin contains some static data that is displayed when navigating to http://localhost:3000/system-info. In this section, we will modify the frontend plugin to invoke the backend plugin API and display the data returned by that API.

Please follow the steps given below to achieve this integration:

  • Delete the following directories:

    plugins/system-info/src/components/ExampleComponent
    plugins/system-info/src/components/ExampleFetchComponent
  • Create a new directory named plugins/system-info/src/components/SystemInfoPage

  • Create a new file named plugins/system-info/src/components/SystemInfoPage/types.ts with the following content:

    plugins/system-info/src/components/SystemInfoPage/types.ts
    import { TableColumn } from '@backstage/core-components';

    export const sysInfoCpuColumns: TableColumn[] = [
    {
    title: 'CPU Model',
    field: 'model',
    },
    {
    title: 'CPU Speed',
    field: 'speed',
    },
    {
    title: 'Times Idle',
    field: 'times.user',
    },
    {
    title: 'Times IRQ',
    field: 'times.irq',
    },
    {
    title: 'Times Nice',
    field: 'times.nice',
    },
    {
    title: 'Times Sys',
    field: 'times.sys',
    },
    {
    title: 'Times User',
    field: 'times.user',
    },
    ];

    export const sysInfoMainDataColumns: TableColumn[] = [
    { title: 'Hostname', field: 'hostname', highlight: true },
    { title: 'OS', field: 'operatingSystem', width: '10%' },
    { title: 'Platform', field: 'platform', width: '10%' },
    { title: 'CPU Model', field: 'cpuModel', width: '10%' },
    { title: 'CPU Speed', field: 'cpuSpeed', width: '10%' },
    { title: 'Total Memory', field: 'totalMem', width: '20%' },
    { title: 'Free Memory', field: 'freeMem', width: '10%' },
    { title: 'Release', field: 'release', width: '10%' },
    { title: 'Uptime', field: 'uptime', width: '10%' },
    ];

    type CpuData = {
    model: string;
    speed: number;
    times: CpuTimeData;
    };

    type CpuTimeData = {
    idle: number;
    irq: number;
    nice: number;
    sys: number;
    user: number;
    };

    type SysInfoMainData = {
    cpuModel: string;
    cpuSpeed: number;
    freeMem: number;
    hostname: string;
    loadavg: Array<number>;
    operatingSystem: string;
    platform: string;
    release: string;
    totalMem: number;
    uptime: number;
    };

    export type SysInfoData = {
    cpus: Array<CpuData>;
    data: SysInfoMainData;
    mainDataAsArray: SysInfoMainData[];
    };
  • Create a new file named plugins/system-info/src/components/SystemInfoPage/SystemInfoPage.tsx with the following content:

    plugins/system-info/src/components/SystemInfoPage/SystemInfoPage.tsx
    import React from 'react';
    import useAsync from 'react-use/lib/useAsync';

    import { Table } from '@backstage/core-components';

    import { Box, Grid, Typography } from '@material-ui/core';

    import { configApiRef, useApi } from '@backstage/core-plugin-api';

    import { SysInfoData, sysInfoCpuColumns, sysInfoMainDataColumns } from './types';

    export const SystemInfoPage = () => {
    const config = useApi(configApiRef);
    const SYS_INFO_BACKEND_URL = 'backend.baseUrl';

    const { loading: isSysInfoLoading, value: sysInfoData } =
    useAsync(async (): Promise<SysInfoData> => {
    const backendUrl = config.getString(SYS_INFO_BACKEND_URL);
    const backendApiEndPoint = `${backendUrl}/api/sys-info/system-info`;
    const systemInfoData = await fetch(backendApiEndPoint)
    .then((res) => (res.ok ? res : Promise.reject(res)))
    .then((res) => res.json());

    // To display the main data in a table, prepare the array to contain the ONLY data we have
    systemInfoData.mainDataAsArray = [];
    systemInfoData.mainDataAsArray[0] = systemInfoData.data;
    systemInfoData.mainDataAsArray[0].cpuModel = systemInfoData.cpus[0].model;
    systemInfoData.mainDataAsArray[0].cpuSpeed = systemInfoData.cpus[0].speed;

    return systemInfoData;
    }, []);

    return (
    <>
    <Grid style={{ marginTop: '1rem' }} container spacing={2}>
    <Grid item xs={10}>
    <Table
    title="System Info Details"
    columns={sysInfoMainDataColumns}
    isLoading={isSysInfoLoading}
    data={sysInfoData?.mainDataAsArray || []}
    options={{
    padding: 'dense',
    pageSize: 1,
    emptyRowsWhenPaging: false,
    search: false,
    }}
    emptyContent={
    <Box style={{ textAlign: 'center', padding: '15px' }}>
    <Typography variant="body1">Backend data NOT found</Typography>
    </Box>
    }
    />
    </Grid>

    <Grid item xs={10}>
    <Table
    title="System Info Details - CPUs"
    columns={sysInfoCpuColumns}
    isLoading={isSysInfoLoading}
    data={sysInfoData?.cpus || []}
    options={{
    padding: 'dense',
    pageSize: 10,
    emptyRowsWhenPaging: false,
    search: false,
    }}
    emptyContent={
    <Box style={{ textAlign: 'center', padding: '15px' }}>
    <Typography variant="body1">Backend data NOT found</Typography>
    </Box>
    }
    />
    </Grid>
    </Grid>
    </>
    );
    };
  • Create a new file named plugins/system-info/src/components/SystemInfoPage/index.ts with the following contents:

    plugins/system-info/src/components/SystemInfoPage/index.ts
    export { SystemInfoPage } from './SystemInfoPage';
  • Modify plugins/system-info/src/plugin.ts by replacing the occurrences of ExampleComponent with SystemInfoPage (modified line is highlighted in the code block given below):

    plugins/system-info/src/plugin.ts
    import { createPlugin, createRoutableExtension } from '@backstage/core-plugin-api';

    import { rootRouteRef } from './routes';

    export const systemInfoPlugin = createPlugin({
    id: 'system-info',
    routes: {
    root: rootRouteRef,
    },
    });

    export const SystemInfoPage = systemInfoPlugin.provide(
    createRoutableExtension({
    name: 'SystemInfoPage',
    component: () => import('./components/SystemInfoPage').then((m) => m.SystemInfoPage),
    mountPoint: rootRouteRef,
    }),
    );
    • Before the change: import('./components/ExampleComponent').then(m => m.ExampleComponent),
    • After the change: import('./components/SystemInfoPage').then(m => m.SystemInfoPage),

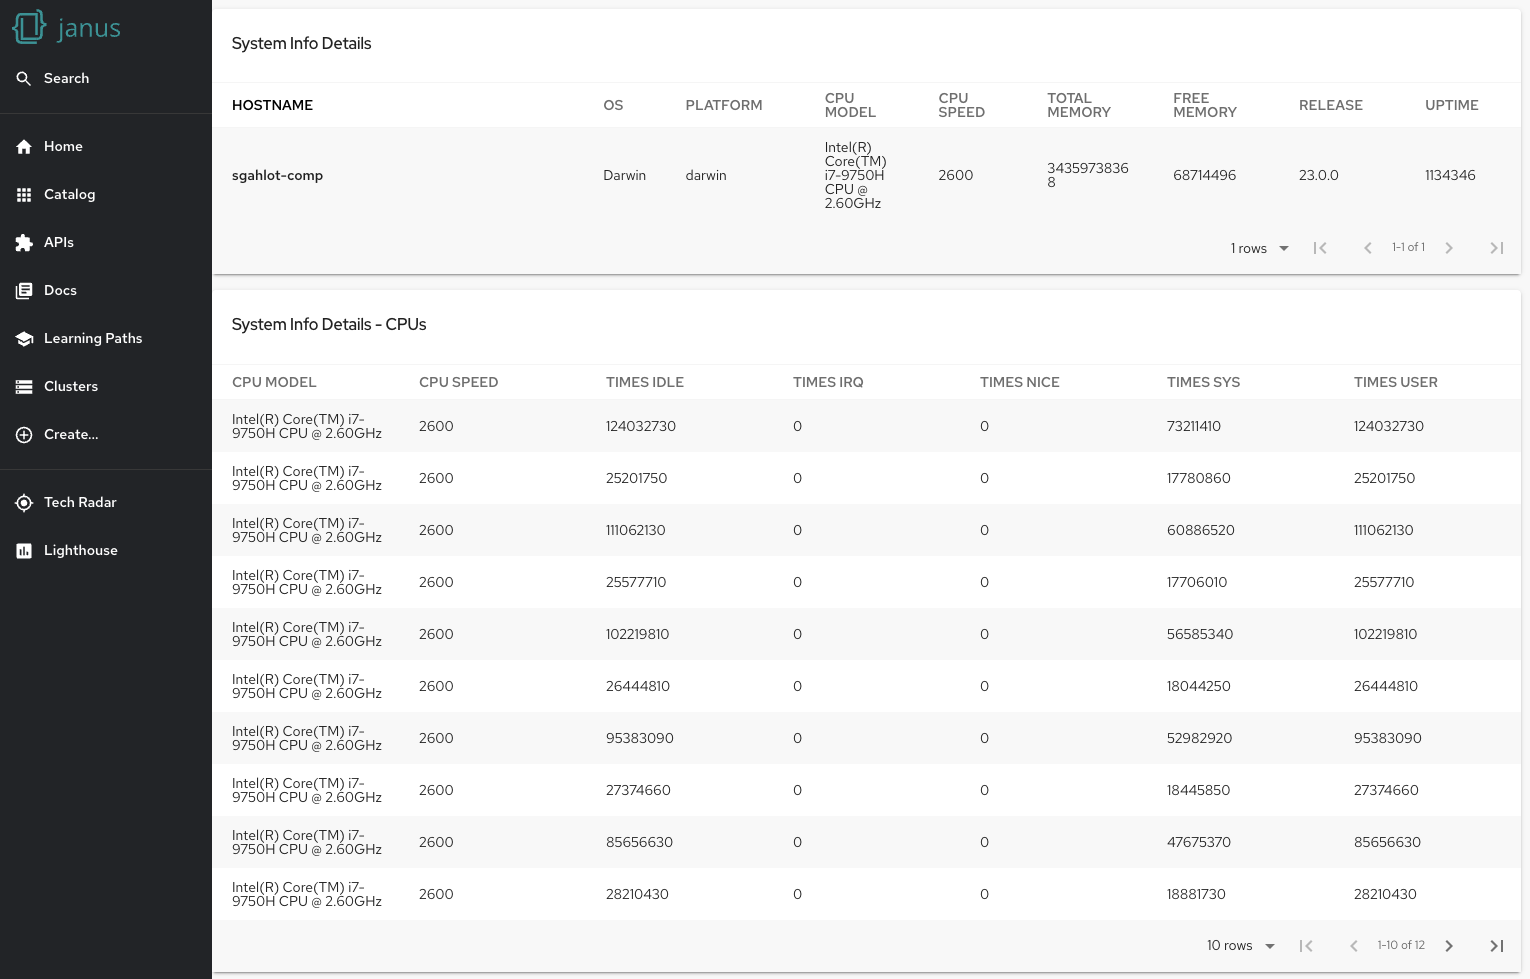
Verifying the integration between the frontend plugin and backend plugin

Now that the plugin is all set, start the app if it is not already started. In case you see any errors, please restart the app with yarn start-dev in the root directory of the backstage-showcase repository, or by following these steps. Once the app starts up, navigate to http://localhost:3000/system-info. This page should provide the System Info Details as shown below:

System Info Details


Analyzing the code

With the frontend plugin integrated with the backend plugin and able to fetch the System information data from the backend and display it in the UI, let us go over the code that made it all possible.

The following files were created (or modified) to achieve this task:

  • plugins/system-info/src/components/SystemInfoPage/types.ts: This file contains the following types that either handle the JSON response coming from the backend plugin or are used as table columns when displaying data:
    • CpuTimeData: Type to contain times attribute of CPU data from the backend plugin JSON response
    • CpuData: Type to contain CPU data from the backend plugin JSON response
    • SysInfoMainData: Type to contain data element from the backend plugin JSON response
    • SysInfoData: Type to contain SysInfoMainData and list (Array) of CpuData data
    • sysInfoCpuColumns: This is a list of fields that are of type TableColumn and are used to display the header for CPU columns.
    • sysInfoMainDataColumns: This is a list of fields that are of type TableColumn and are used to display the header for main data columns.
      • The field property for each element in the list maps to the field that is used to display data from the object containing data for the table.
  • plugins/system-info/src/components/SystemInfoPage/SystemInfoPage.tsx: Main file to invoke the backend API and parse/display data on the UI with the main lines highlighted in the code block:
    • Gets the backend baseUrl (backend.baseUrl) from the config. This property is automatically configured and is available to the frontend plugin with the use of configApiRef
      plugins/system-info/src/components/SystemInfoPage/SystemInfoPage.tsx
          const config = useApi(configApiRef);
      ...
      const backendUrl = config.getString(SYS_INFO_BACKEND_URL);
    • Invokes the backend plugin API (${backendUrl}/api/sys-info/system-info) and extracts the JSON from the response as SysInfoData
      plugins/system-info/src/components/SystemInfoPage/SystemInfoPage.tsx
      const backendUrl = config.getString(SYS_INFO_BACKEND_URL);
      const backendApiEndPoint = `${backendUrl}/api/sys-info/system-info`;
      const systemInfoData = await fetch(backendApiEndPoint)
      .then((res) => (res.ok ? res : Promise.reject(res)))
      .then((res) => res.json());
    • To display the system information data, we are using the following two table components:
      • The first table uses sysInfoMainDataColumns for the columns and sysInfoData?.mainDataAsArray for the main data (mainDataAsArray is set after fetching the data from the backend API).
        plugins/system-info/src/components/SystemInfoPage/SystemInfoPage.tsx
            systemInfoData.mainDataAsArray = [];
        systemInfoData.mainDataAsArray[0] = systemInfoData.data;
        systemInfoData.mainDataAsArray[0].cpuModel = systemInfoData.cpus[0].model;
        systemInfoData.mainDataAsArray[0].cpuSpeed = systemInfoData.cpus[0].speed;
        ...
        <Table
        title="System Info Details"
        columns={sysInfoMainDataColumns}
        isLoading={isSysInfoLoading}
        data={sysInfoData?.mainDataAsArray || []}
        >
      • The second table uses sysInfoCpuColumns for the columns and sysInfoData?.cpus for the CPU data.
        plugins/system-info/src/components/SystemInfoPage/SystemInfoPage.tsx
            <Table
        title="System Info Details - CPUs"
        columns={sysInfoCpuColumns}
        isLoading={isSysInfoLoading}
        data={sysInfoData?.cpus || []}
        >
    • Exports the SystemInfoPage component, which contains the Grid containing the two table components defined above:
      plugins/system-info/src/components/SystemInfoPage/SystemInfoPage.tsx
          export const SystemInfoPage = () => {
      ...
      }
  • plugins/system-info/src/components/SystemInfoPage/index.ts: exports the SystemInfoPage component.
  • plugins/system-info/src/components/SystemInfoPage/plugin.ts: sets the component used by systemInfoPlugin to the SystemInfoPage component
    plugins/system-info/src/components/SystemInfoPage/plugin.ts
    export const SystemInfoPage = systemInfoPlugin.provide(
    createRoutableExtension({
    name: 'SystemInfoPage',
    component: () => import('./components/SystemInfoPage').then((m) => m.SystemInfoPage),
    mountPoint: rootRouteRef,
    }),
    );
    • This SystemInfoPage is used when we hit the route /system-info (set in packages/app/src/App.tsx)

Conclusion

We have now created a new Backstage frontend plugin and integrated it with the backend plugin to display the data coming from the backend plugin. We used types to manage the JSON response and display the Table columns. This just scratches the surface of what can be done in a frontend plugin. As the backend plugin is exposing data through REST API, you can return pretty much whatever you need to process and display the result in your frontend plugin.

Hope you enjoyed this blog!!!


· 5 min read
Divyanshi Gupta

The Janus community recently released the Backstage Topology plugin which provides an intuitive way to visualize and understand the workloads running on your Kubernetes cluster. Currently, the plugin is read-only, allowing you to view and analyze the workload distribution across clusters without making any modifications.

The intuitive graphical representation provides an at-a-glance understanding of the workload distribution across clusters, enabling you to spot issues or imbalances quickly. Whether it's Deployments, Jobs, Daemonsets, Statefulsets, CronJobs, or Pods, this plugin lets you gain insights into the components powering your applications or services.

Topology plugin intro

We introduced the plugin in the previous blog so in this blog post, we will explore the unique features, installation, and usage of the Topology plugin in Backstage.

The Backstage Topology Plugin provides a lot of powerful features going beyond the graphical visualization of Kubernetes workloads. Let's explore the various features that make this plugin outstanding:

Filter workloads by cluster

The plugin empowers you to visualize the workloads of a specific cluster when your workloads are spread across multiple clusters. This functionality allows you to focus on a particular environment or segment of your application infrastructure. This targeted filtering capability makes issue troubleshooting easier and can help with the optimization of resources.

Filter workloads by cluster

Minikube topology

Group workloads

Visualizing workloads into logical sets is made easy with the Topology Plugin. By grouping related workloads, you can manage them collectively, enabling efficient monitoring, scaling, and resource allocation.

To display workloads in a visual group add the following label to your workloads:

labels:
app.kubernetes.io/part-of: <GROUP_NAME>

Group workloads

Establish node Connections and Relationships

The plugin facilitates the establishment of connections between nodes to represent their relationships. This feature enhances your understanding of the dependencies and interactions between different workloads, fostering a comprehensive view of your infrastructure.

To display workloads with visual connectors add the following annotation to your target workloads:

annotations:
app.openshift.io/connects-to: '[{"apiVersion": <RESOURCE_APIVERSION>,"kind": <RESOURCE_KIND>,"name": <RESOURCE_NAME>}]'

Establish node Connections and Relationships

Access the application in a single click

The Topology Plugin simplifies access to the running application associated with your workloads. With a single click, you can easily navigate to the relevant application, saving time and effort.

Access the application in a single click

Application

Get workload insights using the side panel

The plugin also provides a side panel that opens up on selecting a workload. The side panel shows the details of the workload and its connected resources. This level of granularity helps troubleshoot issues, find bottlenecks and fine-tune your workload configurations.

Sidepanel Details tab

Sidepanel Details tab

Sidepanel Resources tab

Sidepanel Resources tab

Installation and configuration

To start leveraging the capabilities of the Backstage Topology Plugin, follow these steps for installation and configuration:

  1. Install the prerequisite Kubernetes plugin, including @backstage/plugin-kubernetes and @backstage/plugin-kubernetes-backend, by following the provided installation and configuration guides.

  2. Configure the Kubernetes plugin to connect to your cluster using a ServiceAccount. Ensure that the ServiceAccount accessing the cluster has the necessary ClusterRole granted. If you have the Backstage Kubernetes plugin configured, the ClusterRole is likely already granted.

  3. Annotate the entity's catalog-info.yaml file to identify whether an entity contains Kubernetes resources:

    annotations:
    backstage.io/kubernetes-id: <BACKSTAGE_ENTITY_NAME>
  4. Optionally, add the backstage.io/kubernetes-namespace annotation to identify Kubernetes resources using the defined namespace:

    annotations:
    backstage.io/kubernetes-namespace: <RESOURCE_NS>
  5. Add a custom label selector to help Backstage find the Kubernetes resources. This label selector takes precedence over the ID annotations:

    annotations:
    backstage.io/kubernetes-label-selector: 'app=my-app,component=front-end'
  6. Label the resources with the following label to allow the Kubernetes plugin to retrieve the Kubernetes resources from the requested entity:

    labels:
    backstage.io/kubernetes-id: <BACKSTAGE_ENTITY_NAME>

    Note: When using the label selector, ensure that the mentioned labels are present on the resource.

  7. Install the Topology plugin using the following command:

    yarn workspace app add @janus-idp/backstage-plugin-topology

Enabling Topology plugin in Backstage app

Now that the Topology plugin is installed and configured, to leverage the Backstage Topology Plugin within your Backstage application, enable the plugin in UI by adding the following code to this file packages/app/src/components/catalog/EntityPage.tsx:

import { TopologyPage } from '@janus-idp/backstage-plugin-topology';

const serviceEntityPage = (
<EntityPageLayout>
{/* ... */}
<EntityLayout.Route path="/topology" title="Topology">
<TopologyPage />
</EntityLayout.Route>
</EntityPageLayout>
);

Using the Topology plugin in Backstage

Now that the plugin is fully set up, once you open your Backstage application and select an entity from the Catalog page, you should see a Topology tab on the entity page. Go to the Topology tab and you will be presented with a graphical view of your service’s workloads.

Next Steps

The Backstage Topology Plugin is a game-changer for managing Kubernetes workloads, offering a range of powerful features designed to simplify visualization, organization, and monitoring. We are also working on adding more cool new features to this plugin so be sure to keep an eye out for the latest updates.

To contribute to this plugin, report issues, seek guidance or provide feedback, please see our GitHub repository https://github.com/janus-idp/backstage-plugins/tree/main/plugins/topology and/or reach out to us on Janus IDP Slack.

· 2 min read
Divyanshi Gupta

The Janus community is thrilled to share details about our Backstage Topology Plugin. This powerful new tool simplifies the process of visualizing k8s workloads of your Backstage services. With this plugin, developers can get a clear and concise overview of their application's structure and workload status. This eliminates the stress and cognitive overload that often comes with working with Kubernetes.

Topology plugin coming soon!

With the Backstage Topology Plugin, you will be able to see a graphical visualization of your backstage service’s workloads and their pods statuses across clusters in real-time with the ability to filter workloads by a specific cluster.

So, what makes the Backstage Topology Plugin so special? For starters, it offers a range of powerful features other than providing a graphical visualization of k8s workloads and that includes providing one click access to the running application, functionality to group workloads in multiple sets, ability to connect nodes to each other to represent their relationships with each other and providing a way to look into the details of the workload and its related resources.

And best of all, the Backstage Topology Plugin is incredibly easy to use. Its intuitive interface and straightforward design mean that you won't have to waste time figuring out how to use it or struggling with complex settings. Instead, you can focus on getting your work done quickly and efficiently.

Next steps

Be on the lookout for a more in depth overview of the Backstage Topology Plugin soon!

Learn more about other Backstage plugins in the Janus community here or join us on the Janus IDP Slack!

· 4 min read
Andrew Block

The Janus project produces container images to support many of the active initiatives within the community. These images, built on top Red Hat certified content, help provide a stable and secure base to enable use in most environments. Previously, these images were only available within the GitHub Container Registry service associated with janus-idp GitHub organization. The Janus community is happy to announce that all images produced by the Janus project are now available on quay.io within the janus-idp organization. quay.io is a hosted registry service for storing and building container images and distributing other OCI artifacts. With this new offering, community members and consumers can take full advantage of the benefits now provided by sourcing container content from quay.io.

The Significance of quay.io Integration

You might be wondering why serving content on quay.io is noteworthy. Let's expound upon several of these reasons:

Security First

Security is a top of mind concern these days, and steps should be taken to ensure that all phases of development and deployment use a secure-first mentality. It was already described how the Janus Project images use certified Red Hat container images, specifically those based on the Universal Base Image (UBI). These freely available images contain the same enterprise grade packages and content as found in Red Hat Enterprise Linux (RHEL), so security and lifecycle management is top of mind.

Another security feature provided out-of-the-box when making use of quay.io as a container registry: image scanning. Each and every image that is published to quay.io undergoes a scan from Clair to determine if any vulnerabilities are present within the image. Having an understanding of whether the image contains any current security concerns is important for both producers and consumers. Producers need to be able to determine whether the content they are producing contains any vulnerabilities and mitigate them appropriately. Consumers, more importantly, seek the ability to understand if the content they are leveraging includes any risks. This is crucial information to have at one's fingertips, as up to half of the content in some publicly hosted registries contain at least one critical vulnerability (Reference). With the Janus images hosted on quay.io, these benefits are now available.

Support Within Enterprise Environments

Backstage along with the concepts preached by Internal Developer Platforms are seeing adoption within many types of environments, including those with enterprise concerns. While every organization is unique, there are some common traits that they share - one of which is leveraging content from trusted sources. Many of these same organizations forbid accessing external resources and operate in a fully disconnected mode. For those that use externally sourced content, steps are typically put in place to enable and allow access to these assets.

OpenShift, Red Hat's Kubernetes distribution, serves platform container images from quay.io. Given that any necessary approval to access external content may have been already completed to use quay.io as a source of content, no additional steps would be needed. Otherwise, adding another namespace (quay.io/janus-idp for example) as an allowed content source may be easier to have approved since other namespaces within the same registry as there is already an existing precedent in place.

Continued Investment of Quay as a Container Registry

Hosting assets within quay.io is another example of the Janus Project supporting the Quay ecosystem. Content stored in Quay (either the hosted quay.io or self managed standalone Product Red Hat Quay) can be visualized thanks to the Quay Backstage plugin providing many of the same data points, including security related data, all available within the Backstage dashboard. A full overview of the Quay Backstage plugin and its features can be found in this article. The Quay Backstage plugin is just one of many plugins developed by the Janus community and can be found in the backstage-plugins repository within the janus-idp GitHub organization.

Simplifying the experience surrounding the use of an Internal Developer Platform is one of the core tenets of the Janus Project, and one way to stay true to this mission is making content more readily accessible and as feature rich as possible. By serving Janus Project related OCI assets within quay.io, project contributors, community members, and consumers can take advantage of this globally hosted service and all of the features it provides.

· 2 min read
Francisco Meneses

Backstage has many features that come out of the box; one of which is the API catalog. The API catalog is responsible for displaying API entities, which are defined in YAML format and can be stored on a git repository and used as a source to register API entities in the catalog.

But, what happens when you already have an API Manager like 3scale that handles your API definitions? To better integrate 3scale and Backstage, the Janus community developed a 3scale backend plugin that imports APIs from 3scale into the Backstage catalog as API entities.

Installation

With this plugin, your APIs from multiple 3scale tenants will be available in the Backstage catalog API entities.

The first step is to install the backend plugin. Navigate to the root directory of your Backstage instance and run the following command to add the plugin.

yarn workspace backend add @janus-idp/backstage-plugin-3scale-backend

Configuration

The 3scale Backstage plugin allows configuration of one or many providers using the app-config.yaml configuration file. Use a threeScaleApiEntity marker to start configuring them:

app-config.yaml
catalog:
providers:
threeScaleApiEntity:
dev:
baseUrl: https://<TENANT>-admin.3scale.net
accessToken: <ACCESS_TOKEN>
schedule: # optional; same options as in TaskScheduleDefinition
# supports cron, ISO duration, "human duration" as used in code
frequency: { minutes: 1 }
# supports ISO duration, "human duration" as used in code
timeout: { minutes: 1 }

Add the 3scale entity provider to the catalog builder at packages/backend/src/plugins/catalog.ts, once done, the catalog plugin should be able to load 3scale products as entities in the Backstage catalog:

packages/backend/src/plugins/catalog.ts
import { ThreeScaleApiEntityProvider } from '@janus-idp/backstage-plugin-3scale-backend';

/ ..
const builder = await CatalogBuilder.create(env);

/** ... other processors and/or providers ... */
builder.addEntityProvider(
ThreeScaleApiEntityProvider.fromConfig(env.config, {
logger: env.logger,
scheduler: env.scheduler
}),
);

const { processingEngine, router } = await builder.build();
/ ..

Verify

Now your API entities will be available in the Backstage catalog.

API entities in the Backstage catalog

Next steps

To contribute to this plugin, report issues, or provide feedback, visit our GitHub repository or contact us on the Janus IDP Slack. Learn more about other Backstage plugins in the Janus community here.

· 4 min read
Tom Coufal

The Janus IDP family of Backstage plugins is expanding! Please welcome our new member - a frontend plugin that enriches application view in Backstage with insights from a Quay hosted registry.

Backstage models the software ecosystem as Backstage Catalog entities. Users compose small individual service components into a bigger picture. And in order to truly understand and fully describe the individual building blocks, Backstage users construct views to capture different aspects of these components; from technical documentation, through dependencies and relation to deployment state, CI and CD. And part of this picture is understanding what is actually being deployed into live environments. In many cases, the deployment artifact is a container image and the desire to view all of the available and deployed container images. This new Quay plugin for Backstage brings in that capability.

Quay is an OCI-compatible registry that allows users to build, store and distribute container images and other OCI artifacts. It is available as a hosted service on quay.io as well as a self-hosted environment deployable to any OpenShift cluster through a Quay operator.

Installation and setup

With this plugin, viewing available container images in a particular repository is easy. The following guide will elaborate in detail on individual steps for enabling the integration and all currently supported settings and options.

First, it is necessary to install the plugin. Please add it to the frontend of your Backstage instance:

yarn workspace app add @janus-idp/backstage-plugin-quay

Connecting to Quay registry via Proxy

The plugin leverages the Backstage native proxy capabilities to query the Quay API; therefore, configurations need to be made to the app-config.yaml. In order to connect the Backstage instance to the public hosted Quay.io environment, the following configuration can be used:

app-config.yaml
proxy:
'/quay/api':
target: 'https://quay.io'
changeOrigin: true
headers:
X-Requested-With: 'XMLHttpRequest'

When accessing private Quay repositories, it may be necessary to extend this configuration with an Authorization header and Quay API token. This token can be obtained by creating a Quay Application using the steps outlined in this documentation. Once a token is obtained, the header can be set by extending the app-config.yaml setup above with an additional header:

app-config.yaml
proxy:
'/quay/api':
target: 'https://quay.io'
changeOrigin: true
headers:
X-Requested-With: 'XMLHttpRequest'
Authorization: 'Bearer ${QUAY_TOKEN}'

Be aware that the QUAY_TOKEN is an environment variable that has to be available to the Backstage instance at runtime.

Another popular option is to be able to target a self-hosted Quay deployment. This can be achieved by simply changing the target property in the settings above with the location of the Quay instance. In addition, if the self-hosted Quay registry is also deployed with a certificate that is not in the certificate chain of trust for the Backstage instance, the secure option has to be unset.

app-config.yaml
proxy:
'/quay/api':
target: '<SELF_HOSTED_QUAY_ENDPOINT>'
changeOrigin: true
headers:
X-Requested-With: 'XMLHttpRequest'
Authorization: 'Bearer ${QUAY_TOKEN}'
secure: [true|false]

More details on available Backstage proxy settings can be found in the upstream documentation.

This plugin conforms to the pattern used by many other Backstage plugins that use the Backstage proxy and provides a mechanism to change the default proxy path /quay/api via the following app-config.yaml settings, if needed:

app-config.yaml
quay:
proxyPath: /custom/quay/path

Enabling Quay plugin widget in UI

Now that the plugin is configured to access the desired Quay registry, enable the UI by enabling an additional view in the frontend application.(packages/app/src/components/catalog/EntityPage.tsx file in the bootstrap application)

packages/app/src/components/catalog/EntityPage.tsx
import { QuayPage, isQuayAvailable } from '@janus-idp/backstage-plugin-quay';

const serviceEntityPage = (
<EntityPageLayout>
// ...
<EntityLayout.Route if={isQuayAvailable} path="/quay" title="Quay">
<QuayPage />
</EntityLayout.Route>
</EntityPageLayout>
);

Using the plugin

Finally, after the plugin is fully set up, it needs to be instructed on what data to display for individual catalog entities. Extend the entity with an annotation, a similar experience Backstage users are used to with other plugins:

metadata:
annotations:
'quay.io/repository-slug': '<ORGANIZATION>/<REPOSITORY>'

For example, if we annotate a Component with 'quay.io/repository-slug': 'janus-idp/redhat-backstage-build', we are presented with the following page:

Backstage view for janus-idp/redhat-backstage-build Quay repository

Next steps

Although this plugin doesn’t have the vast features available in the Quay UI, it brings much-needed value to Backstage users. In the future, we plan to iterate on this plugin and provide users with more insights into unique Quay functions like vulnerability scanning and detailed manifest views.

To contribute to this plugin, report issues, seek guidance or provide feedback, please see our GitHub repository https://github.com/janus-idp/backstage-plugins/tree/main/plugins/quay and/or reach out to us on Janus IDP Slack.

· 3 min read
Tom Coufal

Not so long ago, Red Hat pledged its intention to join the Backstage community. Several weeks later we're starting to see the first fruits of the effort. The Janus community is pleased to announce the availability of the first 2 Backstage plugins created at Red Hat. These plugins target upstream community projects, namely Keycloak and Open Cluster Management. Both plugins are in the early stages of development and are not meant to be used yet in production environments, however we welcome any feedback and suggestions as they continue to mature. Please join us on our path to building a better Internal Developer Platforms for Kubernetes and OpenShift on the Janus IDP community website.

Details related to the first Keycloak and Multicluster Engine plugins for Backstage can be found in the following sections:

Keycloak plugin for Backstage

The need for Identity management is a common concern for any Internal Developer Platform. Backstage already contains the functionality to connect to external identity providers to enable authentication and apply proper RBAC. However, these concerns are not the sole role of identity management in relation to development portals. These portals also focus on accountability, responsibility and relationship of users and contributors to their project. Backstage achieves that through entity relations within a service catalog. All actors and objects are modeled as entities in this catalog and the Keycloak plugin ensures that all of your Keycloak users and groups are properly represented and mapped within the catalog. It allows the Backstage instance to interface with Keycloak directly and perform automatic and recurring importing of assets. Once imported, these user and group entities can be used in the standard Backstage catalog model with the added benefits of Keycloak’s diverse identity brokering capabilities.

MultiCluster Engine plugin for Backstage

One of the key focus areas for Backstage is the ability to provide a full, transparent service catalog to their developers. This includes mapping service dependencies on other components, resource ownership, and many more. Service dependencies should not include only the requirements of other services, but also model the underlying consumed resources. This plugin aims to provide a seamless, automated resource import for companies that use MulticlusterEngine from Open Cluster Management or Red Hat Advanced Cluster Management for Kubernetes (RHACM) for their cluster fleet management. By connecting the Backstage instance to the Hub cluster, all managed clusters are discovered and imported into Backstage as standard catalog resources. In addition, the plugin also provides frontend components that fetch data from the hub cluster through the Kubernetes plugin on the Backstage instance as a proxy allowing users to quickly observe the current status of each of their clusters and providing quick access to the OpenShift console.

What's Next?

We'll be investigating a way to import the managed clusters into the Backstage Kubernetes plugin configuration. This capability will enable Backstage users the ability to observe workloads on the managed clusters and further simplify Backstage catalog maintenance and integration with Kubernetes cluster fleets.